
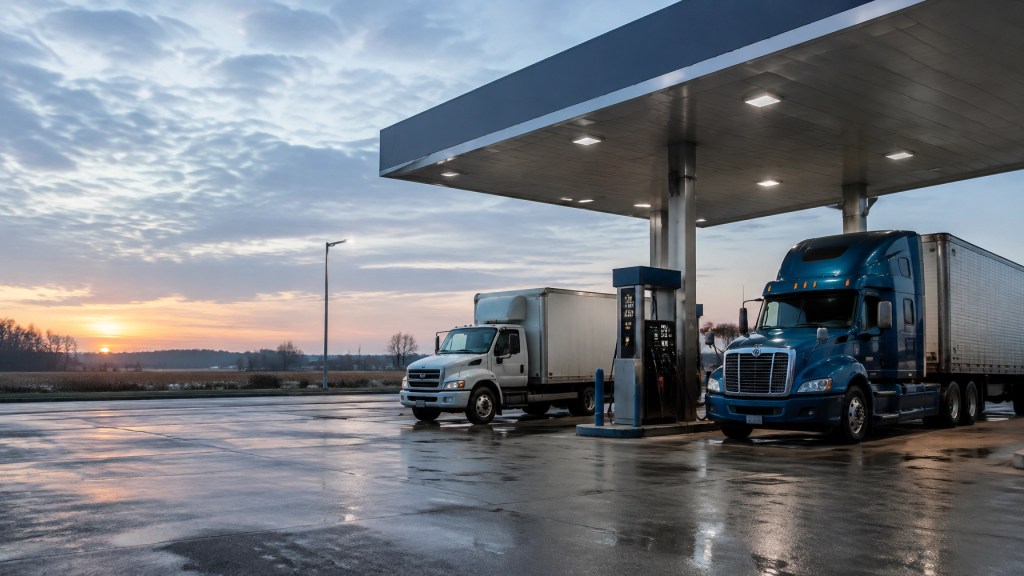
The national average retail diesel price reached $6.529 per gallon for the week of September 21, 2026, according to the U.S. Energy Information Administration. That was up from $6.285 per gallon the previous week.
The increase was not absorbed by one industry. Trucking companies paid it first. Distributors, contractors, landscapers, restaurants, retailers, and households are now confronting the next question: how much of the additional cost can be passed through before customers push back?
The immediate pressure is not simply a crude-oil shortage. Current market analysis points to constrained refining capacity, disrupted refined-product flows, low inventories, and shipping risk around the Strait of Hormuz. Diesel is a refined product. If refineries cannot produce enough of it, crude availability alone does not solve the problem.
This article reports public data and operational considerations. It is not financial, legal, tax, or transportation-rate advice. Why Main Street is not a bank, carrier, broker, or financial adviser and is not responsible for the accuracy of third-party information.

The first hit lands on transportation-heavy businesses
A trucking company cannot postpone fuel purchases until a shipper pays its invoice. The carrier buys diesel today. The customer may pay in 30, 45, or 60 days.
That timing gap is central to the current squeeze.
A standard fuel surcharge is often calculated as:
> Fuel surcharge per mile = (current diesel price − baseline diesel price) ÷ assumed miles per gallon
For illustration, assume:
- Current diesel price: $6.529 per gallon
- Contract baseline: $1.50 per gallon
- Assumed fuel economy: 6 miles per gallon
- Surcharge miles: 1,500 miles
The calculation is:
- Excess fuel price: $6.529 − $1.50 = $5.029
- Surcharge per mile: $5.029 ÷ 6 = about $0.838
- Total surcharge: $0.838 × 1,500 = about $1,257
That is an illustration, not a universal rate. The result changes with the contract baseline, mileage definition, equipment, terrain, fuel economy, and regional diesel price.
The EIA’s diesel fuel FAQ provides the benchmark data commonly used in freight agreements. A carrier using a national average may experience a materially different result from one using the EIA regional average.
On September 21, the EIA reported diesel at:
- $6.680 per gallon in the Midwest
- $7.456 per gallon on the West Coast
- $8.246 per gallon in California
- $6.177 per gallon on the Gulf Coast
A national average can therefore understate the cost faced by a business operating in a high-price region.

What the price means by business type

Small trucking companies
Small carriers face the most direct exposure. Fuel is purchased frequently, while freight payments arrive later. A surcharge that is updated weekly but collected months later may not cover the cash-flow gap.
The problem becomes more severe when a contract uses:
- An outdated fuel index
- A low assumed fuel price
- Loaded miles only
- No treatment of deadhead miles
- No provision for idling or reefer fuel
- A surcharge paid only after delivery paperwork is approved
Owners should distinguish between linehaul revenue and fuel reimbursement. A fuel surcharge is not a substitute for a profitable linehaul rate. It is intended to address fuel-cost changes.
Deadhead miles should be defined in writing. If the customer agrees to pay for loaded miles plus a defined amount of repositioning, the contract should state that clearly. If deadhead is not separately included, the carrier may need to use an effective MPG assumption that reflects its actual operating pattern.
Stationary fuel also matters. Idling, yard movement, refrigeration units, and waiting time can consume diesel without producing additional miles. Those costs can be incorporated into a realistic effective MPG figure or addressed through separate accessorial charges.
Delivery businesses and local fleets
Last-mile delivery operators often have less pricing power than long-haul carriers. They may serve restaurants, pharmacies, retailers, or online sellers under fixed monthly agreements.
For these companies, route density is critical. A van that makes more deliveries per mile is less exposed than one traveling long distances between isolated stops.
Operators should review:
- Revenue per route
- Stops per mile
- Failed-delivery mileage
- Empty return miles
- Driver waiting time
- Fuel consumed while loading or idling
The issue is not merely the fuel bill. It is the cost per completed delivery.

Landscapers and construction companies
Landscapers use diesel for trucks, trailers, mowers, chippers, and other equipment. Construction businesses face fuel costs in vehicles and heavy machinery.
These companies can be hit twice: once through their own fuel purchases and again through supplier price increases. Materials transported by truck may arrive with a higher delivered cost even when the product price itself has not changed.
Contracts should specify whether fuel escalation applies to:
- Transportation only
- Equipment operation
- Mobilization and demobilization
- Emergency or after-hours work
- Extended travel outside the normal service area
A vague “fuel adjustment” clause invites disputes. A defined index, review date, baseline, and mileage rule creates a better evidentiary record.
Restaurants and retail businesses
Restaurants with delivery fleets face higher costs per order. Retailers face higher inbound freight expenses. Grocery stores may see fuel costs reflected in the delivered price of food, packaging, and refrigeration supplies.
A business does not need to raise every price by the same percentage. It can instead identify the products, routes, or services with the highest transportation exposure.
That approach is more defensible than a broad, unexplained surcharge.
Five steps owners can take now

1. Audit surcharge language
Pull every freight, delivery, vendor, and service agreement that contains a fuel clause. Confirm the baseline price, index, update frequency, effective date, mileage definition, and payment timing.
A surcharge that cannot be reconciled to a published benchmark is difficult to enforce.
2. Use the correct regional EIA benchmark
The EIA publishes national and regional data. Use the region that most closely corresponds to the operation or the agreed freight lane.
The contract should identify the precise EIA series and the week used for calculation. “DOE average” is not sufficiently specific if the parties could mean different regions or products.
3. Measure actual fuel consumption
Do not rely only on a generic 6 MPG assumption. Track fuel purchases, odometer readings, idling, reefer use, and deadhead.
A simple weekly report can show:
- Gallons purchased
- Total miles
- Loaded miles
- Deadhead miles
- Fuel cost per mile
- Revenue per mile
- Surcharge billed
- Surcharge collected
The purpose is not accounting theater. It is to determine whether the surcharge is covering the cost it was designed to cover.

4. Consolidate routes and loads
Route planning is now a margin-control tool. Combine deliveries where practical. Reduce empty returns. Schedule maintenance near existing routes. Avoid sending lightly loaded vehicles long distances for low-value work.
The best fuel-saving decision is often made before the vehicle leaves the yard.
5. Protect payment timing
A surcharge collected 45 days after fuel is purchased may still leave the business borrowing to operate. Owners should review invoice terms, approval procedures, fuel-card programs, and customer payment history.
A faster invoice process may be worth more than a small rate increase. Dedicated fuel cards can also provide purchase controls, transaction records, and negotiated discounts, although the fees and terms must be reviewed.
The hiring market is firm, but small-business confidence is cooling
The fuel shock is arriving while labor remains difficult to source.
The NFIB August 2026 employment data showed:
- The Small Business Employment Index fell 0.3 points to 101.8
- The share of owners hiring or trying to hire fell 5 points to 56%
- A net 17% planned to create jobs over the next three months, down 3 points
- 35% reported unfilled openings
- Among owners hiring, 82% reported few or no qualified applicants
NFIB also reported that owners were citing tariff-related costs and supply-chain disruption. Labor quality remained a leading concern.
At the same time, the U.S. Department of Labor’s weekly claims data showed initial unemployment claims at 197,000 for the week reported September 24, indicating that layoffs remained limited.
The combination is unusual but not contradictory. Businesses can face difficulty finding qualified workers while becoming more cautious about adding payroll. A transportation company may need drivers and mechanics but hesitate to expand because fuel, equipment, financing, and insurance costs are all rising.
Households will see the pass-through

Diesel moves more than trucks. It affects agricultural equipment, construction machinery, warehouse operations, delivery fleets, and the transportation of consumer goods.
That does not mean every retail price increase is caused by diesel. Labor, tariffs, rent, insurance, materials, and financing also matter. But transportation is embedded in the cost structure of many products.
Some claims circulating about the U.S.–Iran conflict state that the average household has absorbed approximately $1,760 in additional costs and that Americans are facing a $100 billion energy bill. Those figures could not be tied to a verifiable primary source in the research reviewed for this article. They should not be presented as established fact without a documented methodology and source.
What is verifiable is that disruption around the Strait of Hormuz has raised shipping and refined-product concerns. The Congressional Research Service has documented the importance of the chokepoint and the effects of conflict on global energy markets.
What to watch next
The next phase depends on whether the fuel shock feeds into broader inflation and whether demand remains resilient.
Key dates and indicators include:
- September CPI: scheduled for October 14, according to the Bureau of Labor Statistics calendar
- October FOMC meeting: October 27–28, according to the Federal Reserve calendar
- September PCE inflation: scheduled for October 29, according to the BEA release calendar
- Weekly EIA diesel prices and regional spreads
- Inventory levels and refinery utilization
- Jobless claims and small-business hiring plans
- Consumer spending and freight volumes
On September 16, the Federal Reserve raised the federal funds target range to 3.75%–4.00%, the first increase since 2023. Higher rates increase the cost of working capital, trucks, trailers, inventory, and expansion.
Oxford Economics’ U.S. indicator has reportedly entered recession-warning territory, while consumer spending has not yet shown a comparable collapse. That is a warning signal, not a conclusive recession finding.
For Main Street owners, the practical conclusion is narrower: measure fuel exposure, document contract terms, protect cash flow, and separate verified data from unsupported claims.
For more reporting on the economy, business conditions, and current events, visit Why Main Street’s current events section. Why Main Street is a member-owned social platform, not a bank, lender, carrier, broker, or financial adviser. Readers remain responsible for verifying facts and consulting qualified professionals before making business or financial decisions.


Leave a Reply